
Experimental investigation of SRS polarization pulling in depleted pump regime for various pump SOPs
- Dawis IT Sp. z o.o., ul. Staszica 1, 05-800 Pruszków, Poland
- Institute of Telecommunications, Warsaw University of Technology, ul. Nowowiejska 15/19, 00-665 Warsaw, Poland
Article Info
Received 01 Oct. 2023
Received in revised form 20 Jan. 2024
Accepted 21 Jan. 2024
Available on-line 29 Feb. 2024
Keywords: Stimulated Raman scattering; all-optical polarization control; polarization pulling.
Abstract
This article presents an experimental investigation of polarization pulling based on stimulated Raman scattering induced by a continuous, fully polarized pump wave in an optical fibre. By means of probe wave states of polarization aggregation, degree of polarization and gain analysis, an assessment of all-optical polarization control, repolarization and amplification in a standard single mode fibre in depleted pump regime is presented. Polarization pulling is proved to be dependent on fibre length, pump power, and pump state of polarization, with respect to pump depletion effect, acting oppositely to the polarization pulling effect. Authors evaluate results aiming to obtain a configuration of stimulated Raman scattering parameters, which allows for the most effective polarization pulling, with respect to statistical stability of the process measured by standard deviation of polarization degree and polarization-dependent gain of the probe wave. The highest polarization attraction efficiency was obtained for 15 km, 0.97 W and the horizontal polarization state of the pump wave.
Introduction
Nonlinear effects can occur in an optical fibre undercertain conditions regarding optical power of propagatinglight, fibre length, and nonlinearity. In case of optical fibretelecommunications, those effects are usually mitigateddue to the potential degradation of transmission perfor-mance. Inter-channel crosstalk induced by four wavemixing (FWM) in wavelength division multiplexing(WDM) can be considered as an example of this negativeimpact [1, 2]. However, there are various applications ofnonlinearity of the fibre that, if controlled properly, can beused as a tool in transmission or sensing systems. All-optical polarization control can be regarded as an exampleof exploiting nonlinear interaction between optical wavespropagating in optical fibre. One can find several solutionsfor all-optical polarizers exploiting different effects likestimulated Brillouin scattering (SBS) [3–5], FWM [6, 7],or stimulated Raman scattering (SRS) [8–12]. SRS throughits nature offers both co-propagation and counter-propagation configurations of a pump and probe wave.
With the simultaneous amplification of a probe wave and a wide bandwidth of interaction with a pump wave [12], SRS was the object of interest for authors when investigat-ing all-optical polarization control. Vector model of SRS in a co-propagation configuration in an optical fibre can be described by a set of two coupled differential equations [8]
\( \begin{aligned} \frac{d \boldsymbol{S}}{d z}= & \frac{g}{2}\left[(1+3 \mu) P_0 \boldsymbol{S}+(1+\mu) S_0 \boldsymbol{P}-2 \mu \boldsymbol{P}_3 S_0\right] \\ & -\alpha_{\mathrm{S}} \boldsymbol{S}+\left(\boldsymbol{\beta}_{\mathrm{S}}+\boldsymbol{W}_{\mathrm{S}}^{\mathrm{NL}}\right) \times \boldsymbol{S} \end{aligned} \) (1)
\( \begin{aligned} \frac{d \boldsymbol{P}}{d z}= & -\frac{\omega_{\mathrm{p}}}{2 \omega_{\mathrm{s}}} g\left[(1+3 \mu) S_0 \boldsymbol{P}+(1+\mu) P_0 \boldsymbol{S}-2 \mu \boldsymbol{S}_3 P_0\right] \\ & -\alpha_{\mathrm{p}} \boldsymbol{P}+\left(\boldsymbol{\beta}_{\mathrm{p}}+\boldsymbol{W}_{\mathrm{P}}^{\mathrm{NL}}\right) \times \boldsymbol{P}, \end{aligned} \) (2)
where 𝑺 and 𝑷 denote the probe and pump vectors, 𝛼𝑆 and 𝛼𝑃 are the fibre attenuation coefficients for probe and pump waves frequencies,
\( \omega_{\mathrm{s}}=2 \mu c \lambda_{\mathrm{s}}^{-1} \text { and } \omega_{\mathrm{p}}=2 \mu c \lambda_{\mathrm{p}}^{-1} \)
Sare the probe and pump frequencies (𝑐 =3∙108 ms-1, 𝜆S=1552 nm, 𝜆P=1455 nm), 𝑔 is the Raman gain coefficient equal to 0.60 W-1/km for the frequency corresponding to 𝜔=𝜔P−𝜔S, 𝑆0 and 𝑃0 are the probe and pump powers,where 𝑺 and 𝑷 denote the probe and pump vectors, 𝛼𝑆 and 𝛼𝑃 are the fibre attenuation coefficients for probe and pump waves frequencies,
\( \boldsymbol{P}_3=P_3 \hat{e}_3 \text { and } \boldsymbol{S}_3=S_3 \hat{e}_3 \)
represent the projections along the unit vector 𝑒̂3 in Stokes space, 𝜷S and 𝜷P are the linear birefringence vectors for the probe and pump frequencies according to random modulus model (RMM) [11], 𝑾SNL and 𝑾PNL represent the influence of nonlinear polarization rotation (NPR) on probe and pump waves states of polarization (SOPs) due to self and cross-phase modulation (SPM, XPM). Factor 𝜇 represents the polarization dependence of the gain, as the effective gain coefficient ranges from 𝑔(1+5𝜇/3) to 4𝑔𝜇 /3, which depends on relative orientation of pump and probe waves SOPs [9, 11]. From the point of view of the probe SOP, this leads to a preferable amplification of a probe wave SOP component, which is more parallel to the pump SOP. The result of this amplification feature is the polarization pulling of the probe SOP towards the pump SOP [12].Authors of this article choose to experimentally investigate how effectively the polarization of the probe wave can be controlled by a strong pump wave SRS interaction, with a simultaneous degree of polarization (DOP) and amplification analysis. Efficient polarization pulling could be an alternative to polarization control or polarization tracking procedures used in a polarization division multiplexing (PDM) or coherent detection systems [13–19].
Materials and methods
Figure 1 presents a block scheme of the experimental setup. A TLX-1 Laser Module by Thorlabs was used as a 1552 nm probe source with an optical power (𝑆0,nom) set to 1.4 mW. Polarization scrambler (Keysight Agilent N7788B) sample rate (SR) equal to 5 kS/s and rotation speed (Rot) equal to 160 rad resulted in a Poincaré sphere covered with 10 000 samples of probe wave SOPs for 2 s time of measurement (𝑇). Result of scrambling is presented in Fig. 3(a). Scrambling procedure modifies not only the probe wave SOP, but also the probe wave power at the input of the fibre (𝑆0(0)), reducing it to 0.7 mW because of a polarization scrambler insertion loss (ILscr) equal to 3 dB. For this value of 𝑆0(0),the pump depletion had to be considered [9, 12].
CRFL-02-1455 by LEA Photonics was chosen as a 1455 nm pump source. Through the fact that the CRFL-02-1455 is a random polarization source, a polarization beam splitter (PBS) was used to obtain a polarized pump wave,which together with a polarization controller (PC) enabled to obtain stability and control over the pump wave SOP. This procedure affects the maximum nominal pump power (𝑃0,nom), reducing it by approximately 3.5 dB. Therefore, the optical power of the pump wave at the input of the fibre (𝑃0(0)) was effectively changed from 0.56 W to 1.15 W. An optical coupler (OC) is used to combine pump and probe waves into the fibre (FIB). Fibre spools of 10 km and 15 km of a G.652.D fibre were used during experiment. Value of 𝛾𝑆P responsible for 𝑾SNL is equal to approximately 1.24 (W ∙ km)-1 [8, 9]. Polarization mode dispersion (PMD) and chromatic dispersion (CD) coefficients of the fibre spools were estimated by producer at 0.02 ps/√km and 17 ps/(nm ∙ km), respectively. Optical filter (FIL) was used to separate pump and probe waves after a fibre spool. Attenuation elements (ATT) were necessary in order to dispose a post-fibre pump wave and protect a photodiode in a polarization analyser from excessive optical power. Fig. 2 presents a modified setup used for setting pump SOP at the input of the fibre. Connection between OC and polarimeter input was performed with polarization maintaining fibre in order to assure stability of a pump SOP when switching to the setup presented in Fig. 1 for a probe signal analysis. During the procedure of the pump SOP setting, a 1552 nm source was not active.

Table 1 presents the most important parameters of the experimental setup and measurements procedure.
Table 1.
Parameters of the experiment..
Parameter |
Symbol |
Value |
Nominal probe wave power |
𝑆0,nom |
1.4 mW |
Probe wave power at the input of the fibre |
𝑆0(0) |
0.7 mW |
Probe wavelength |
𝜆S |
1552 nm |
Polarization scrambler insertion loss |
ILscr |
3 dB |
Polarization scrambler sample rate |
SR |
5 kS/s |
Polarization scrambler rotation speed |
Rot |
160 rad |
Time of measurement |
𝑇 |
2 s |
Number of probe wave samples |
Sc |
10 000 |
Maximum nominal pump wave power |
𝑃0,nom |
2.6 W |
Pump wave power at the input of the fibre |
𝑃0(0) |
0.56–1.15 W |
Pump wavelength |
𝜆S |
1455 nm |
Fibre length |
𝐿 |
10 km, 15 km |
Fibre nonlinear Kerr coefficient (XPM related) |
𝛾𝛾SP |
1.24 (W∙km)-1 |
PMD coefficient |
PMD |
0.02 ps/√km |
Chromatic dispersion @1550 nm |
CD |
17 ps/(nm∙km) |
Results assessment
Assessment of the polarization pulling effectiveness was performed by calculation of an angle between every point representing the probe SOP and the centre of the SOPs cluster. The maximum value of these angles set was chosen as a metric for the worst-case scenario of polariza-tion pulling efficiency. Example of the post-pulling Poincaré sphere with a marked centre of the SOPs cluster (red *) and a SOP with the maximum angle value (red X) is presented in Fig. 3(b). The maximum angle values 𝛼max for different pump powers, pump SOPs, and fibre lengths are presented in section 3.

In order to obtain a complete analysis of the polariza-tion changes of the probe wave average ON-OFF gain, polarization dependent gain (PDG), average DOP, and standard deviation of DOP (𝜎DOP) of the probe wave were also investigated. PDG values for all pump power settings and for certain configuration of pump SOP and fibre length were calculated as a difference between the maximum and minimum values of gain [8, 9]
\( \mathrm{PDG}_i=\max \left(G_{R, i}\right)-\min \left(G_{R, i}\right) \) (3)
where 𝑖 denotes the 𝑖-th pump optical power setting. Array (𝑮𝑹,𝒊) contains gain values calculated using the ON-OFF method for every probe wave SOP for the 𝑖-th pump optical power setting.
In addition, through the fact of using the pump source of a CW power above 0.5 W, it is necessary to assess noise performance of the polarization pulling process, as any amplified spontaneous emission (ASE) amplification process, which in the case of SRS effect results from a spontaneous version of Raman scattering caused by vacuum fluctuations. Also, in the case of SRS and co-propagation configuration considered in this publication, a transfer of pump power fluctuations to the probe wave, resulting in relative intensity noise (RIN), has to be considered. A suitable noise figure (NF), including both vacuum fluctuations and RIN sources was proposed in Refs. 20–22
\( \mathrm{NF}=1+\frac{G(L)-1}{G(L)}+2 \alpha_{\mathrm{S}} D_{\mathrm{INV}} \) (4)
where 𝐺(𝐿)=𝑮r(L)exp (−𝛼sL) denotes the net Raman gain and
\( D_{\mathrm{INV}}=\int_0^L \frac{1}{G(z)} d z \) (5)
represents the vacuum fluctuations, understood as an input shot noise contributing through its amplification to output noise. It is useful to introduce an equivalent NF [20]
\( \mathrm{NF}_{\text {eq }}=\mathrm{NF} \exp \left(-\alpha_{\mathrm{S}} L\right) \) (6)
Equivalent NF is related to a hypothetical preamplifier of gain 𝐺𝑅 introducing the same amount of noise as a distributed amplifier.
Results
Fig. 4 and 5 present the 𝛼max values with respect to pump power, for three pump SOPs and for both 10 km and 15 km fibre spools. It can be observed that for 10 km, horizontal and vertical pump SOPs increasing pump power leads to an 𝛼max reduction in the entire range of pump powers, resulting in the minimum value of 𝛼max equal to 55° for 1.15 W. Differences in polarization pulling effi-ciency for available pump SOPs are evident, especially for 𝑃0(0)∈〈0.6 0.85〉 W, where the horizontal pump SOP offers the fastest aggregation of the probe wave SOPs. Using a longer fibre spool results in a change of the shape of the 𝛼max characteristics. For both horizontal and vertical pump SOPs, the constant reduction of 𝛼max values in the entire range of pump powers values is no longer evident. For horizontal pump SOP and 𝑃0(0)∈〈0.65 0.97〉 W, 𝛼max values significantly decrease much more slowly, still resulting in the minimum 𝛼max value equal to 50°. Higher pump power values result in 𝛼max increase. Identical tendency is observed for the vertical pump SOP, however, the minimum 𝛼max value obtained equals 80° for 0.95 W. For a +45° pump SOP, using a 15 km fibre does not imply a significant change in 𝛼max characteristics. Similar results were presented in Refs. 10 and 12, where the average angle of 40° between the probe and the pump is shown.


Obtained DOP values of probe wave for a 10 km fibre are presented in Fig. 6, whereas for 𝜎DOP probe wave is shown in Fig. 7. One can observe a partial probe wave repolarization for a 10 km fibre and all pump SOPs analysed, although different pump SOPs show different maximum value of DOP. For a horizontal pump SOP and 𝑃0(0)>0.97 W, DOP value remains at a maximum of approximately 91%. Similarly to a vertical pump SOP, DOP value does not rise above 95%. Using a +45° pump SOP does not result in a probe wave repolarization saturation with a constant growth of DOP value. At the same time, 𝜎DOP values decrease for 𝑃0(0)>0.65 W, which is the sign of probe wave DOP fluctuations reduction in the repolarization process.


Results of DOP and 𝜎DOP for a 15 km fibre are presented in Fig. 8 and 9. For 𝑃0(0) > 0.91 W, all analysed pump SOPs show DOP values in the range from 89% to 95%. However, for 𝑃0(0) > 0.91 W, depolarization of probe wave is evident, which is clear for horizontal and vertical pump SOPs, resulting in a DOP value drop even to 75%. Depolarization of probe wave is accompanied by increas-ing probe wave DOP fluctuations, which is depicted by rising 𝜎DOP values for 𝑃0(0)>0.91 W. Similar mean DOP values (95%) for the corresponding product value 𝑃0(0)𝐿𝛾SP were presented in Refs. 9 and 18, reporting also 𝜎DOP of a probe wave equal to or lower than approximately 10% with pump depletion influence on polarization pulling observed.
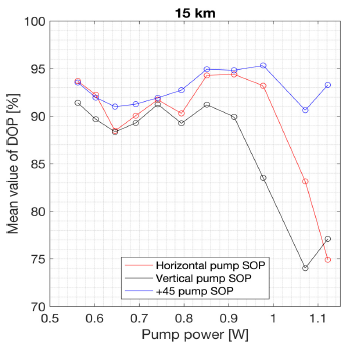

Fig. 10 and 11 present the obtained mean values of ON-OFF gain for all pump SOPs and 10 km and 15 km fibre spools. It can be observed that for a 10 km fibre, gain values for all pump SOPs increase monotonically with increasing pump power reaching approximately 21 dB for 1.15 W for all pump SOPs. Gain value of 18 dB was observed for 10 km and 1 W, which corresponds to the results in Ref. 18 for 𝑃0(0)𝐿𝛾SP= 12.24. Using a 15 km fibre preserves a constant growth of gain values and, at the same time, increases the maximum value of gain to approximately 26 dB.


For both lengths of the fibre spool, no effect of gain saturation was observed. In contrast to the gain characteris-tics, the obtained PDG values presented in Fig. 12 and 13 depend strongly on pump SOP. At maximum pump power, PDG value for vertical pump SOP exceeds 16 dB, while for horizontal pump SOP, PDG value is above 9 dB for the same pump power. Moreover, for 𝑃0(0)>0.8 W, PDG value changes insignificantly, from 8 dB to 9 dB. Using +45° pump SOP results in oscillations of PDG values, as for 𝑃0(0)>0.8 W, PDG value varies from 8 dB to 12 dB. Extending the interaction distance to 15 km results in different properties of PDG characteristics. For all pump SOPs, PDG value tends to increase with increasing pump power to the maximum value and then is reduced with further growing pump power. Both the maximum PDG value and pump power for which it is obtained depend on pump SOP and so for +45° pump SOP, PDG constantly grows with pump power up to 15 dB for 0.91 W, while horizontal and vertical pump SOPs exhibit maximum PDG values, equal to, respectively, 11 dB and 12 dB for approximately 0.7 W value of pump power. For higher pump powers, PDG is reduced, which is more evident for horizontal pump SOP.
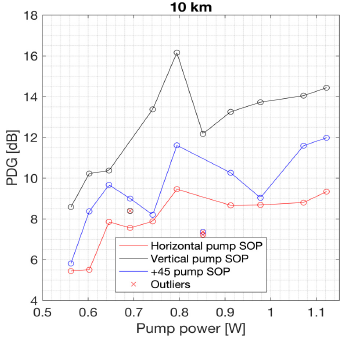
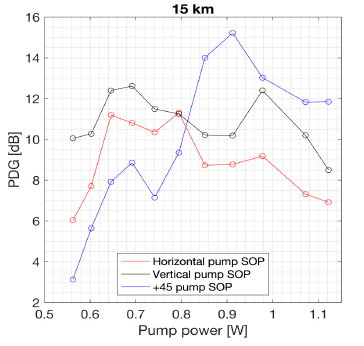
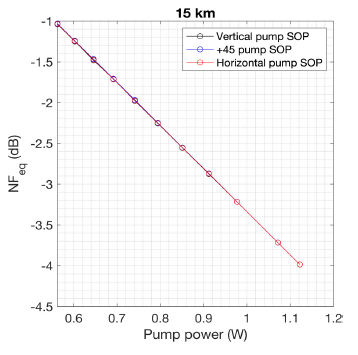
Fig. 14 and 15 present the estimated values of equivalent NFs for Raman aplification process for 10 km and 15 km fibre spools. It is evident that for both fibre spools, lenght with increasing pump power leads to growth in gain, NFeq values decrease. For a pump power equal to 0.9 W and a fibre length of 15 km, inde-pendently on pump SOP, NFeq is equal to approximately −3 dB, which is a comparable result to −2.5 dB presented for a 20 dB ON-OFF gain reported in Ref. 20.

Discussion
It can be observed that the correlation between effectiveness of polarization pulling, DOP, and amplifica-tion of probe wave was experimentally confirmed. For a 10 km fibre, the increasing DOP value of probe wave is the sign of the influence of the pump wave with a high DOP value sustaining through the entire process of interaction between pump and probe wave. At the same time, linear gain characteristics suggest that amplification process was not saturated, which resulted in decreasing 𝛼max values. Obtained PDG values are interesting from the point of view of effectiveness of polarization pulling for different pump SOPs. In spite of higher maximum values of PDG and DOP, vertical and +45° pump SOPs exhibit higher 𝛼max values, indicating lower efficiency of polarization pulling, for 𝑃0(0)>0.7 W. Even when 𝛼max for different pump SOPs becomes comparable, which occurs for 𝑃0(0)>0.7 W, PDG values for a horizontal pump SOP are lower than for other two pump SOPs.
This is interesting because, from the point of view of SRS properties, PDG is necessary for polarization pulling to occur. Achieved results prove that some pump SOPs can offer comparable polarization pulling with a lower PDG value than other pump SOPs. As a result, it is possible to search for an optimal configuration, offering not only the maximum polarization pulling efficiency, but also the lowest possible PDG values. The analysis of both 𝛼max and PDG values and the correlation between them is important as high PDG values are considered to have a negative impact on the performance of transmission systems [19]. Using a 15 km fibre allows to observe the rise of 𝛼max values with a simultaneous probe wave depolarization for 𝑃0(0)>0.7 W. This effect is caused by pump depletion, which occurs when the probe wave by means of amplification becomes strong enough to influence pump wave by creating its depolarization and DOP fluctuations. This effect is represented by the third and fourth terms in (2), which becomes significant when probe wave power becomes comparable with pump wave power.
Since amplification process has not been saturated yet, DOP fluctuations of pump wave lead towards further depolarization of probe wave (Fig. 8) and increase probe wave DOP fluctuations (Fig. 9). This is also the reason why DOP characteristics do not follow the 1 − 𝐺-1 rule described for undepleted pump regime in Refs. 23 and 24 for a 15 km fibre spool. For a 10 km fibre spool, no amplification saturation nor pump depletion effects are visible, therefore, DOP characteristics follow the 1 − 𝐺-1 rule for un-depleted pump regime. However, for a 15 km fibre, spool pump depletion leads to a partial probe wave depolarization for pump powers above 0.9 W and the 1− 𝐺-1 rule is not followed. Effect of pump depletion together with NPR influence on SRS polarization pulling in co-propagation configuration was analysed in Ref. 9. As shown, the NPR becomes important when the beat length (𝐿B) is comparable or larger than nonlinear length
\( L_{\mathrm{N}}=\frac{1}{p_{\mathrm{o}} \gamma_{\mathrm{SP}}} \) (7)
Beat length of the fibre spools used during experiments that are the subject of this article was estimated using the PMD coefficient-related expression [11]
\( \mathrm{PMD}_C=\frac{16 \sqrt{L_{\mathrm{F}}}}{\sqrt{3} \omega_{\mathrm{s}} L_{\mathrm{B}}} \) (8)
where 𝐿F denotes the correlation length of the fibre. 𝐿F value was assumed to be equal to 50 m, as it is the most common and reasonable value for standard single mode fibres [11]. With this assumption, 𝐿B value was found equal to approximately 85 m, while with available pump power and 𝛾𝛾SP value of fibre spools, 𝐿N ranges from 700 m to 1580 m. With estimated 𝐿B and 𝐿N values, NPR influence on polarization pulling can be neglected, therefore, pump depletion itself is responsible for probe wave depolarization for pump powers higher than 0.91 W. Analysis of the nature of interaction between pump and probe waves proves that in case of partial depolarization and DOP fluctuations of pump wave, probe wave SOP changes induced by pump influence can be regarded as a superposition of interaction between polarized and depo-larized parts of pump light and probe wave. In that case, a fully polarized part of pump wave adds constructively to both polarization pulling and amplification, whereas depolarized part does not have influence on probe wave SOP, acting only in terms of optical power gain.
Therefore, with reduced amount of energy constructively taking part in polarization pulling and repolarization, its effectiveness is also reduced. With lower efficiency of polarization pulling and repolarization, degradation influence of fibre birefringence becomes dominant causing further probe wave SOP randomization. Obtained PDG values corre-spond to 𝛼max characteristics, in the way that growing PDG value indicates rising effectiveness of polarization pulling. For a horizontal pump SOP, the maximum of PDG characteristics obtained for approximately 0.7 W corre-sponds to infliction point in 𝛼max characteristics, resulting in decrease in 𝛼max values reduction speed for growing pump power values. This comes with reduction of PDG values, which is the sign of vanishing difference in pump wave influence on orthogonal components of probe wave SOP and, thus, reduction of polarization pulling effectiveness. Analogically to the configuration with a 10 km fibre, the horizontal pump SOP presents higher efficiency of polarization pulling than other SOPs. More-over, when comparing results for horizontal and vertical pump SOPs, one can observe that lower 𝛼max values for horizontal SOP are coincidental with similar PDG values, especially for 𝑃0(0)∈〈0.65 0.97〉 W. This allows to achieve the best polarization pulling efficiency, measured by 𝛼max equal to approximately 50° for 0.97 W of pump power, with simultaneous lowest possible PDG value of 9 dB. Mean DOP, 𝜎DOP, and G equal to 93%, 8% and 23 dB, respectively, are also achievable with this configuration.
Although it is clear that 𝛼max, DOP and PDG characteristics are strongly dependent on pump SOP, this connection vanishes in case of estimated NFs. All three pump SOPs for both lengths of fibre spools result in almost indistinguishable NFeq values. This actually follows a fundamental amplified field fluctuations model used for NF derivation. Analysis of (4) shows that increasing gain values brings NF values close to 3 dB quantum limit, therefore, the lowest of NF value is achieved by minimi-zation of vacuum fluctuations term 𝐷INV. That gives 𝐷INV a dominant role for NF calculation. One may deduce that definition of 𝐷INV, by means of inverse integration of mean gain over distance, acts as averaging mechanism and eliminates differences in NF values for pump SOPs. Obtained NFeq values prove it to be more evident for high ON-OFF gain values. For the 10 km fibre spool and pump power equal to 0.6 W, which corresponds to an ON-OFF gain close to 10 dB for horizontal pump SOP, differences between NFeq values do not exceed negligible 0.05 dB, while for a 1 W pump power, they vanish entirely. What is common for all pump SOPs is that with increasing pump powers, NFeq decreases. As observed in Ref. 21, this suggests that noise level is low in the process of SRS and effective amplification overcomes fibre attenuation.
Conclusion
In this article, an experimental analysis of polarization pulling based on SRS in optical fibre was shown. Authors focused on probe wave SOP changes induced by influence of pump wave with known SOP and power. Apart from the polarization and DOP analysis, ON-OFF gain and PDG values with respect to pump power and SOP were analysed. It was proved that for a 10 km G.652.D fibre with an estimated value of PMD coefficient equal to 0.02 ps/√km and lack of pump depletion, it is possible to obtain a constant rise of polarization control efficiency for 𝑃0(0) < 1.15 W. For a 15 km fibre, effect of pump depletion became evident and resulted in probe wave depolarization and increasing DOP fluctuations for 𝑃0(0) > 0.91 W. Pump depletion was also responsible for reduction of polarization pulling efficiency, as less pump wave energy remained fully polarized. NF values, obtained by means of an amplified field fluctuations model, show that with growing gain values, NF decreases. That suggests that noise level in amplification process is relatively low in used pump power range and amplification overcomes attenuation of the fibre. Moreover, there are no significant differences between obtained NFs for different pump SOPs through dominant influence of vacuum fluctuations on NF value. For both fibre lengths, different polarization pulling efficiency was observed for different pump SOPs, which allows to optimize polarization pulling configuration with respect to achievable DOP, gain, and PDG values. Maximum efficiency of polarization control was achieved for a 15 km fibre, horizontal pump SOP, and 0.97 W of pump power, resulting in 𝛼max equal to 50°, DOP value of 93%, 8% value of 𝜎DOP, G equal to 23 dB and 9 dB PDG value. Authors consider investigating the opportunity to exploit this all-optical SRS-based polarization pulling as a tool for automatic polarization control in optical communication systems.
Acknowledgements
Research was funded by the Centre for Priority Research Area Artificial Intelligence and Robotics of the Warsaw University of Technology within the Excellence Initiative: Research University (IDUB) programme. Project no. 1820.342.Z01.POB2.2021.
References
-
Elschner, R., Richter, T. & Schubert, C. Characterization of FWM- Induced Crosstalk for WDM Operation of A Fiber-Optical Parametric Amplifier. in 37th European Conference and Exposition on Optical Communications. Optica Publishing Group Mo.1.A.2 (Optica Publishing Group, 2011). https://doi.org/10.1364/ECOC.2011.Mo.1.A.2
-
Phillips, M. R., Wu, K.-Y. & Villarruel, F. X. Four-wave-mixing- induced crosstalk and distortion in subcarrier-multiplexedlightwave links: Theory and measurement. J. Light. Technol. 26, 2647–2652 (2008). https://doi.org/10.1109/JLT.2008.927196
-
Gu, J. et al. Polarization dependence of stimulated Brillouin scatter- ing-based switchable microwave photonic filter. Opt. Appl. 49, 5–11 (2019). https://doi.org/10.5277/oa190101
-
Soto, M. A., Tur, M., Lopez-Gil, A., Gonzalez-Herraez, M. & Thevenaz, L. Polarisation pulling in Brillouin optical time-domain analysers. Proc. SPIE 10323, 103239L (2017). https://doi.org/10.1117/12.2267649
-
Samaniego, D. & Vidal, B. Brillouin wavelength-selective all- optical polarization conversion. Photon. Res. 8, 440–447 (2020). https://doi.org/10.1364/PRJ.371513
-
Guasoni, M., Kozlov, V. V. & Wabnitz, S. Theory of polarization attraction in parametric amplifiers based on telecommunication fibers. J. Opt. Soc. Am. B 29, 2710–2720 (2012). https://doi.org/10.1364/JOSAB.29.002710
-
Fatome, J. et al. All-optical regeneration of polarization of a 40 Gbit/s return-to-zero telecommunication signal. Photon. Res. 1, 115–123 (2013). https://doi.org/10.1364/PRJ.1.000115
-
Lin, Q. & Agrawal, G. P. Vector theory of stimulated Raman scattering and its application to fiber-based Raman amplifiers. J. Opt. Soc. Am. B 20, 1616–1631 (2003). https://doi.org/10.1364/JOSAB.20.001616
-
Ursini, L., Santagiustina, M. & Palmieri, L. Raman nonlinear polarization pulling in the pump depleted regime in randomly birefringent fibers. IEEE Photon. Technol. Lett. 23, 254–256 (2011). https://doi.org/10.1109/LPT.2010.2098024
-
Martinelli, M., Cirigliano, M., Ferrario, M., Marazzi, L. & Martelli, P. Evidence of Raman-induced polarization pulling. Opt. Express17, 947–955 (2009). https://doi.org/10.1364/OE.17.000947
-
Galtarossa, A., Palmieri, L., Santagiustina, M. & Ursini, L. Polarized backward Raman amplification in randomly birefringent fibers. J. Light. Technol. 24, 4055–4063 (2006).https://doi.org/10.1109/JLT.2006.883640
-
Muga. N. J., Ferreira, M. F. S. & Pinto, A. N. Broadband polarization pulling using Raman amplification. Opt. Express 19, 18707–18712 (2011). https://doi.org/10.1364/OE.19.018707
-
Peng, C.-W. et al. DP-QPSK coherent detection using 2D grating coupled silicon based receiver. IEEE Photon. J. 13, 1–5 (2021). https://doi.org/10.1109/JPHOT.2020.3043592
-
Li, C. et al. Convolutional neural network-aided DP-64 QAM coherent optical communication systems. J. Light. Technol. 40, 2880–2889 (2022). https://doi.org/10.1109/JLT.2022.3146839
-
Tabares, J., Ghasemi, S., Polo, V. & Prat, J. Simplified carrier recovery for intradyne optical PSK receivers in udWDM-PON. J. Light. Technol. 36, 2941–2947 (2018). https://doi.org/10.1109/JLT.2018.2831918
-
Barrio, M., Izquierdo, D., Sevillano, P. & Garcés, I. Coherent PolMux Reception Using a Low-Cost Heterodyne Receiver. in 2023 Conference on Lasers and Electro-Optics Europe & European Quantum Electronics Conference (CLEO/Europe-EQEC) 1–1 (IEEE, 2023). https://doi.org/10.1109/CLEO/Europe-EQEC57999.2023.10232301
-
Jiang, C. et al. Cross-Polarization Error Correction Enhanced Polarization-Division-Multiplexed Differential Detection System for Optical Fiber Communications. in 2023 Opto-Electronics and Communications Conference (OECC) 1–6 (IEEE, 2023). https://doi.org/10.1109/OECC56963.2023.10209856
-
Wang, S. H. & Wai, P. K. A. Polarization Pulling in Fiber Optical Parametric Amplifiers. in 2016 21st OptoElectronics and Communi- cations Conference (OECC) held jointly with 2016 International Conference on Photonics in Switching (PS) 1–3 (IEEE, 2016).
-
Panayiotou, T., Antoniades, N. & Ellinas, G. On the impact of polarization-dependent gain/loss for optical multicast sessions. Opt. Express 22, 29827–29834 (2014). https://doi.org/10.1364/OE.22.029827
-
Bristiel, B., Jiang, S., Gallion, P. & Pincemin, E. New model of noise figure and RIN transfer in fiber Raman amplifiers. IEEE Photon. Technol. Lett. 18, 980–982 (2006). https://doi.org/10.1109/LPT.2006.873551
-
Bristiel, B., Gallion, P., Jaouen, Y. & Pincemin, E. Intrinsic noise figure derivation for fiber Raman amplifiers from equivalent noise figure measurement. in Proc. of the Lightwave Technologies in Instrumentation and Measurement Conference 135–140 (IEEE, 2004). https://doi.org/10.1109/LTIMC.2004.1371010
-
Isoe, G. M. et al. Noise Figure and Pump Reflection Power in SMF- Reach Optical Fibre for Raman Amplification. in AFRICON 2015 1–5 (IEEE, 2015). https://doi.org/10.1109/AFRCON.2015.7332036
-
Kozlov, V., Nuño, J., Ania-Castañón, J. & Wabnitz, S. Analytic theory of fiber-optic Raman polarizers. Opt. Express 20, 27242– 27247 (2012). https://doi.org/10.1364/OE.20.027242
-
Kozlov, V., Nuño, J., Ania-Castañón, J. & Wabnitz, S. Theory of fiber optic Raman polarizers. Opt. Express 35, 3970–3972 (2010). https://doi.org/10.1364/OL.35.003970