
A novel generation expansion planning in older power plants – hybrid spotted hyena-particle swarm optimization
- Department of Electrical and Electronics Engineering, Ramco Institute of Technology, Rajapalayam, Tamil Nadu, India
- Department of Electronics and Communication Engineering, Sri Eshwar College of Engineering, Coimbatore, Tamil Nadu, India
- Department of Electrical and Electronics Engineering, Kalasalingam Academy of Research and Education, Krishnankoil, Tamil Nadu, India
- Department of Electrical and Electronics Engineering, PSN College of Engineering and Technology, Tirunelveli, Tamil Nadu, India
Article Info
Received 06 Jan. 2024
Received in revised form 23 Feb. 2024
Accepted 04 Jul. 2024
Available on-line 10 Aug. 2024
Keywords: generation expansion planning; particle swarm optimization; spotted hyena optimization; retirement; recuperation; Tamil Nadu.
Abstract
Due to their lower productivity, lower reliability, and lower economic stability, older power plants are leading to higher carbon emissions. Rather than simply focusing on the retirement and recuperation of power plants, this study focuses on generation expansion planning (GEP). Considering recuperation is economically and environmentally beneficial to power the power generating company. These criteria have made the GEP problem more complex. Hence, the applications of optimization algorithms are required to solve these complex, constrained, and large-scale problems. In this study, an effective hybrid spotted hyena-particle swarm optimization (HSHPSO) algorithm is proposed to handle the GEP problem for the Tamil Nadu power system. This case study addresses the GEP problem for a 7-year planning horizon (2020–2027), as well as a 14-year planning horizon (2020–2034). A significant reduction in total cost and pollution occurs by including retirement and recuperation in GEP. To prove the effectiveness of the proposed HSHPSO technique, it is compared with the existing technologies such as particle swarm optimization (PSO) and differential evolution (DE). Compared to GEP with no recuperation or retirement, the total cost and CO2 emissions of the GEP have been reduced by 11.07% and 9.48%, respectively. Also, the results demonstrate that the HSHPSO algorithm outperformed other algorithms.
Introduction
The recuperation or up-gradation of a power plant is a fundamental concept aimed at continuing the operation of generating units for their prolonged lifetime [1]. Generally, power plants have been specified with a limit to yield the actual capacity efficiently. Essentially, the recuperation concept emerges because of the low acces-sibility feature, minimum productivity, growing operating and maintenance prices, loss of unwavering quality, drop-in security, and enhanced environmental emissions [2, 3].
The generation expansion planning (GEP) problem intends to determine the optimum place, period, category, and capacity of new power plants by fulfilling the economic and environmental constraints [4, 5]. Due to the frequently defective and outdated power plants, efficiency has decreased, and the force and outage charges may go up, which would reduce the total performance. In such instances, either retirement or recuperation has been applied to the power plants to ensure economical and reliable operation. The concept of recuperation is broader than maintenance [6, 7]. The recuperation includes redesigning and changing considerable elements of the power plants to extend their lifetime. Retirement is a concept of selling the salvageable parts of the retiring plants, the reprocessing system, and the specific property of the power plants [8]. But in recuperation, older power plants have been extended to last long for generating electricity efficiently and reliably. However, recuperation can be implemented by giving an intense look at several portions of the power plants which have varied lifetimes. Moreover, every component may necessitate unique economic strategies for recuperation [9].
Different optimization techniques have been utilized to solve several GEP problems in the last two decades. Particularly, the GEP problem is handled in a synthetic test system using the particle swarm optimization (PSO) algorithm to attain the minimum cost of planning above the enduring planning period [10]. A GEP modelling framework has been developed for Iran’s power system to acquire economic planning using PSO [11]. It is intended to escalate the use of renewable energy sources (RES) and improve energy efficacy in the source and consumer areas. The GEP problem in a competitive framework has been solved for a pool market using PSO [12]. It maximizes the profit of each generation company by satisfying the emission constraint over the planning horizon. Moreover, PSO is employed in numerous problems regarding transmission network expansion planning [13], distributed generation planning [14], and economic dispatch problems [15]. It reveals the superiority of the PSO in solving power system optimization problems. Hence, the PSO technique has drawn more consideration from the power sectors and has been implemented in several multifaceted power systems optimization problems. PSO involves a smaller number of parameters that impact the solutions; it is easy to implement and results in stable convergence characteristics [16]. Moreover, the PSO algorithm has high probability and efficiency in finding the global-optimal solution quickly [17]. The GEP problems have been widely studied in the financial, environmental, and technical aspects.
The generation expansion planning problem has been formulated to meet the load development economically and reliably [18]. It has been solved by minimizing CO2 emissions [19] and by minimizing the outages of power plants [20]. The RES, for instance, wind and solar, have penetrated the generating system to minimize greenhouse gas (GHG) emissions [21]. The GEP problem is handled by taking into account technical and economic constraints, where the retirement of the power plants is also considered [22]. In those studies, the salvage cost has been deducted from the overall planning cost of GEP. The GEP problem for a small hydropower plant has been attempted by upgrading that plant to improve the performance, profits, and flexibility [23, 24]. Similarly, the Guri hydropower plant has been modernized to improve its physical strengths and efficiency while solving the GEP problem [25]. The short-term GEP, by considering the recuperation of a geothermal power plant, has been carried out from 2005 to 2007 to increase efficiency and reliability and to minimize the maintenance cost and CO2 emission [26].
Most recently, the GEP for the Andra Pradesh power sector from 2021 to 2050 is analysed using a low emission analysis platform (LEAP) software [27]. The findings indicate that, given the state’s economic problems, a low demand growth scenario will be the best option for the power industry. The government should prioritize energy conservation and set a 4.5% demand growth cap. To increase the penetration of renewable energy, a flexibility-oriented GEP model has been introduced [28]. The model takes better reserve requirements into account and inte-grates GEP and unit commitment. Short-term operational restrictions are taken under consideration because of applying GEP and unit commitment. Furthermore, it is crucial to take better reserve needs into account in the suggested model given the rise in renewable portfolio standards (RPS) and the requirement to precisely define the reserve requirements.
To address the GEP issue, a brand-new bidirectional soft-linking method has been introduced [29]. The methodology performance is evaluated using flexibility metrics. To couple the long- and short-term difficulties, an adaptive day for peak reserve is proposed, with the rolling horizon technique being applied in the short-term problem.
In this study, the recuperation-based GEP problem has been solved for a practical power system, namely Tamil Nadu Power System, in India, where the recuperation has been considered for the equipment such as condensers, turbines, burners, generators, gate valves, and boilers, etc. in the power plant. Turbines and the generator are the most essential equipment in a power plant. Moreover, they can increase efficiency by optimizing the shape of turbine blades and by using discharging steam properly. The lifetime of the boilers is lower than that of the turbines, and hence, the expired boiler should be recuperated. The pipe connections between the boilers and the water cycling tanks can be considered in the recuperation. The recuperation of the condensers and control valves can be helpful to enhance the flexibility of a power plant [30–32]. From the previous works, it is recognized that the recuperation-based GEP problem is not carried out for a real-world or a large-scale power system. This research work aims to resolve the generation expansion planning problem for the Tamil Nadu power system by considering both recuperation and retirement, where the minimization of emission, cost, and enhancement of reliability have been achieved. The problem has been solved using a hybrid spotted hyena-particle swarm optimization (HSHPSO) algorithm.
Recent studies have shown that planned optimization is expensive, unreliable, power-dependent, and prone to energy crises. Due to its nonlinearity, distribution system expansion planning (DEP) is a mixed-integer nonlinear programming (MINLP) problem with several decisions to be evaluated. Extended timelines and restricted operational flexibility are growing increasingly prevalent. Environmental pollution is impacted by every phase of fossil fuel activities, such as power plants, which include costs associated with producing electricity and GHG emissions, distributing it, and teaching end users. Inspiration drives this scientific endeavour. To address the GEP problem, this paper uses an effective HSHPSO method. This study is unique because it analyses the recovery of older units.
The novelty of the proposed work is described below:
- An HSHPSO algorithm is proposed to handle the generation expansion planning problem for the Tamil Nadu power system.
- Estimation of the ideal solution to the GEP problem by considering the recuperation of the older units for the 7-year (up to 2027) and 14-year (up to 2034) planning limit.
- Analysing the influence of recuperation of older units on the amount of CO2 emitted from power plants and the total cost of operation.
- Calculation of reliability indices, for instance, expected energy not served (EENS) and loss of load probability (LOLP).
The remaining work is organized as follows. Section 2 describes the problem formulation, objective, and con-straints of the presented work. The proposed HSHPSO and its implementation steps is depicted in section 3. Section 4 clearly illustrates the four case results and debates. Finally, section 5 depicts the conclusion.
Problem formulations
Objective function
This section provides a mathematical formulation for the objective functions. The objectives considered are reliability enhancement, cost minimization, and pollution emissions minimization. The estimated values of the electricity demand until 2034 are adapted from Ref. 33 Financial, methodical, and recuperation data for existing and new units are adapted from Refs. 34–37.
The objective function (fitness function) of the research work is expressed in (1):
\( \text { Obj_fn }=\sum_{t=1}^T\left[I\left(U_t\right)+M\left(X_t\right)+O\left(X_t\right)-S\left(U_t\right)+R\left(X_t\right)\right] \) (1)
where I(Ut) is the N-dimensional vector of incorporated plants at stage t, M(Xt) is the whole operation and mainte-nance cost of prevailing and the recently incorporated plants, in USD. O(Xt) is the outage cost of existing and incorporated plants, in USD. S(Ut) is the salvage value of the incorporated plant at interim t, in USD. R(Xt) is the total recuperation cost of existing plants, in USD.
Where
\( X_t=X_{t-1}+U_t \quad(t=1,2, \ldots, T) \) (2)
\( I\left(U_t\right)=(1+d)^{-t} \sum_{i=1}^N\left(C I_i \times \mathrm{U}_{t, i}\right) \) (3)
\( M\left(X_t\right)=\sum_{s^{\prime}=0}^1\left((1+d)^{1.5+t^{\prime}+s^{\prime}}\left(\sum\left(X_t \times \mathrm{FC}\right)+\mathrm{MC}+\mathrm{EC}\right)\right) \) (4)
\( O\left(X_t\right)=\mathrm{EENS} \times \mathrm{OC} \times \sum_{s^{\prime}=0}^1\left((1+d)^{1.5+t^{\prime}+s^{\prime}}\right) \) (5)
\( R\left(U_t\right)=(1+d)^{-t} \sum_{i=1}^N\left(C I_i \times \mathrm{U}_{t, i}\right) \) (6)
\( S\left(U_t\right)=(1+d)^{-T^{\prime}} \sum_{i=1}^N\left(C I_i \times \delta_i \times U_{t, i}\right) \) (7)
\( t^{\prime}=t-1 \) (8)
\( T^{\prime}=T-t^{\prime} \) (9)
EENS was used to calculate the cost of the outage. To estimate the reliability indices, the equivalent energy function method [35] was employed:
Ut is the N-dimensional vector of incorporated plants at stage t, U(t,i) is the total incorporated plants of category i in stage t. X(t) is the aggregate size vector of the dominant plants at stage t, in megawatt (MW), s' is the inconstant employed to designate that the maintenance costs are assessed in the middle of each year. d represents the discount rate, δi is the salvage factor of plant i, T is the planning duration, N is the whole dissimilar categories of plants, FC represents the plant fixed operation and maintenance cost, in USD/MW, EC is the plant emission cost, USD/MW, MC is the inconstant operation and maintenance cost of the plants, in USD. CIi is the capital investment cost of plant t, in USD. EENS is the planned energy not delivered in MWh, and OC is the outage cost coefficient in USD/MWh.
Restraints
Brief descriptions of restraints have been presented in this section. The details of the restraints have been given.
Higher building bound
Let Ut be the plants going to be dedicated for GEP at period t that should fulfil the maximum building bound of the plants to be dedicated.
\( 0 \leq U_t \leq U_{\max , t} \) (10)
where Umax,t is the maximum building bound of the plants at period t.
Demand
The designated plants should fulfil the minimum demand.
\( \sum_{i=1}^N X_{t, i} \geq D_t \) (11)
where X(t,i) is the collective size of plant i at stage t, Dt is the demand at stage t, in MW.
Reliability standard
The chosen plants, along with the existing plants, must meet the LOLP dependability index.
\( \operatorname{LOLP}\left(X_t\right) \leq \varepsilon \) (12)
where ε is the reliability standard stated in LOLP.
Norms assumed in this study
The following assumptions have been made from the previous research experience [4, 20, 36, 38]:
- The data of the candidate power plants, such as hydro, biomass, coal, solar, oil, nu clear, gas, and wind, have been adopted from “The Vision Tamil Nadu 2023”.
- The salvage factor (δ) for biomass, solar, wind, hydro, nuclear, oil, gas, and coal has been set as 0.2, 0.2, 0.2, 0.2, 0.15, 0.15, 0.1, and 0.1, respectively.
- The discount rate has been fixed at 8.5%.
- A rehabilitation program has been formulated for plants that are going to be retired and for inefficient plants. A list of the data on the recuperation of the coal-fired power plants is adapted from Ref. 36.
- Power plant capital investment expenses are anticipated at the start of the project.
- The cost of EENS has been fixed as 0.05 USD/kWh.
- The salvage cost is applied after the planning period.
Proposed – HSHPSO algorithm-based GEP problem process
This research aims to solve the GEP problem for the Tamil Nadu power system by considering both recupera-tion and retirement, minimizing cost and emissions, and improving dependability. The spotted hyena optimization (SHO) and PSO algorithms are hybridized, and the HSHPSO algorithm is used to tackle the problem, as shown in Fig. 1. Brief descriptions of PSO, SHO, and hybrid HSHPSO have been presented in this section.
Spotted hyena optimization (SHO)
The spotted hyena is the largest and most skilled hunting species of the hyena family. Search, encirclement, hunting, and attacking prey are the four key steps of the spotted hyena algorithm [39], which are described below.
Encircling prey:
Other search agents may adjust their locations according to the target prey ideal location to encircle it:
\( D_h=\left|K \cdot P_p(x)-P(x)\right| \) (13)
\( P(x+1)=P_p(x)-M \cdot D_h \) (14)
where, M2 – the distance between the prey and the spotted hyena, x – current iteration, Pp – prey position, P – the spotted hyena position, K and M are the coefficients. Calculation of K and M [40]:
\( K=2 \cdot r d_1 \) (15)
\( M=2 h \cdot r d_1-h \) (16)
\( \begin{aligned} & h=5-\left(\text { iter } \times\left(5 / \text { Max }_{\text {iter }}\right)\right) \\ & \text { iter }=0,1,2, \ldots, \text { Max }_{\text {iter }} \end{aligned} \) (17)
Hunting
When the best search agent is used, the optimal solutions should be clustered and saved to update the positions of other search agents. For this mechanism to function, it must satisfy the following equations:
\( D_h=\left|K \cdot P_h-P_k\right| \) (18)
\( P_k=P_h-M \cdot D_h \) (19)
\( C_h=P_k+P_{k+1}+\cdots+P_{k+N} \) (20)
where Pk – the position of other hyenas, Ph – the position of the first best hyena, and N – number of spotted hyenas which is calculated as follows:
\( N=C_{n o}\left(P_h, P_{h+1}, P_{h+2}, \ldots,\left(P_h+E\right)\right) \) (21)
where E – the random variable in [0.5, 1].
Attacking prey (exploitation)
It is necessary to reduce the value of h to describe this behaviour. Due to changing h, the variation in M decreases, as well [41]. During simulation runs, h can decrease from 5 to 0. Attacking behaviour can be expressed mathemati-cally as below:
\( P(x+1)=\frac{C_h}{N} \) (22)
where P(x + 1) keeps a record of the optimal solution and updates other agents positions.
Search for prey (exploration)
The searching mechanism describes an algorithm exploration capability. The SHO algorithm ensures this capability in cases where M contains random values greater than 1 or less than −1. By avoiding the local optimum, K ensures that the SHO algorithm behaves more randomly.
Particle swarm optimization (PSO)
A PSO algorithm is advantageous because it has a rapid convergence rate, is easy to use, and is accurate when solving non-linear and discrete problems. Until the termination criterion was met, the search procedure for an optimum value was continued. The velocity and particle positions have been analysed as follows [42]:
\( V_i^{k+1}=W V_i^k+C_1 r_1\left(P_{\text {best }_i}-P_i^k\right)+C_2 r_2\left(G_{\text {best }}-P_i^k\right) \) (23)
\( P_i^{k+1}=P_i^k+V_i^{k+1} \) (24)
where Vik and Pik are the velocity and the position of particle i at iteration k, respectively. Vik +1 and Pik +1 are the velocity and location of particle i at iteration k, respectively. Pbesti is the best location of particle i until iteration k, C1, C2 are the local weight, Gbest is the global best location. W refers to the inertia weight, r1, r2 are the random variables that are uniformly distributed throughout [0, 1], and k is the iteration number [43].
Hybrid spotted hyena-particle swarm optimizer (HSHPSO)
In this section, the basic SHO and PSO are hybridized to improve the convergence speed. The main goal of the proposed HSHPSO is to solve the objective problem and provide optimal results by improving the hunting strategy of SHO using PSO. As shown in (23), the hunting mechanism of the spotted hyena has been modified to incorporate particle swarm velocity update mechanisms as shown below:
\( \begin{aligned} P_k= & \alpha \times P_k+M_1 \times \operatorname{Rand}() \times\left(P_h-D_h\right)+ \\ & M_2 \times \operatorname{Rand}() \times\left(P_h-D_h\right), \end{aligned} \) (25)
where Ph is the position of first best obtained spotted hyena, Pk is the position of other spotted hyenas, M2 defines the distance between the prey and the spotted hyena, α defines the inertia weight, M1 and M2 represent the self-confidence and social coefficients, respectively, and Rand( ) is the random number in range [0, 1].
The steps involved in solving the recuperation-based GEP problem have been given as follows:
- Step 1. Set the algorithm settings, such as population size, to default.
- Step 2. Read the inputs of the power demand forecast, recuperation data of power plants, and technical and financial data of prevailing, as well as nominee units.
- Step 3. Set the best control parameters of the algorithm parameters and maximum iterations (k).
- Step 4. Choose the iteration k = 1.
- Step 5. Update each search agent fitness function using (1) and set the constraints using (10)–(12).
- Step 6. Determine the group of optimum results, i.e., cluster, using (18) and (21), until a satisfying result is discovered.
- Step 7. Update the positions of search agents with (22).
- Step 8. Compute the updated fitness value for the search agent and update the vector Ph if the new optimal solution is better than the previous optimal solution.
- Step 9. Update the fitness value of the spotted hyenas Ch group.
- Step 10. Check the stopping criterion and if it does not reach the maximum iterations (k < kmax), then set k = k + 1 and go to step 5 to explore the optimum result recurrently. Otherwise, stop the program.
Results and discussion
The proposed HSHPSO method is used to tackle Tamil Nadu’s recuperation-based GEP problem. The primary goal of this expansion strategy is to reduce costs and emissions and improve reliability while meeting opera-tional and technical limits and satisfying load demand. This planning is done in the following four different cases. The recuperation-based GEP problem in Tamil Nadu is addressed in four separate cases: Case 1: GEP without recuperation or retirement. Case 2: GEP considering retirement. Case 3: GEP considering recuperation. And Case 4: GEP considering both recuperation and retirement.
After 50 trail runs, the optimal control settings were determined. For all algorithms, the particle size is set to 50, and the number of iterations is set to 200.
Case 1: GEP without retirement or recuperation
For the 7-year planning span, the minimum cost result is attained by the differential evolution (DE) algorithm. The size for the 7-year planned horizon would be 28 250 MW. Biomass, solar, wind, hydro, nuclear, oil, gas, and coal plants would have the added capacities of 180 MW, 2125 MW, 1000 MW, 50 MW, 4275 MW, 960 MW, 3600 MW, and 15 000 MW, respectively. Hence, the accumulative capacity would turn out to be 60 548 MW. Furthermore, LOLP, EENS, CO2 discharge, and total costs are attained as 0.3604 Days/Year, 1.9610 × 10⁶ MWh, 7.4327 × 10¹⁰ kg, and 1.7192 × 10¹² INR (Indian Rupee), respectively. Likewise, for the 14-year planning period, the minimum cost results are attained by the HSHPSO algorithm. The capability for an extension has been assessed as 54 597 MW, where biomass, solar, wind, hydro, nuclear, oil, gas, and coal plants contribute 252 MW, 4000 MW, 2125 MW, 135 MW, 7125 MW, 2320 MW, 8640 MW, and 30 000 MW, respectively. The accumulative capacity has been evaluated as 87 955 MW. Likewise, LOLP, CO2 emission, EENS, and total cost are estimated as 0.1834 Days/Year, 13 2304 × 1010 kg, 2.6029 × 10⁶ MWh, and 3.3572 × 012 INR, respectively.
Case 2: GEP with retirement
The HSHPSO provides the best outcomes throughout a 7-year planning period, with an expansion capacity of 25 974 MW where biomass, solar, wind, hydro, nuclear, oil, gas, and coal plants contribute 144 MW, 2875 MW, 1250 MW, 75 MW, 3800 MW, 1200 MW, 2880 MW, and 13 750 MW, respectively. Therefore, the accumu-lative capacity would turn out to be 59 332 MW. Furthermore, the LOLP, emitted CO2, EENS, and total costs are assessed as 0.6792 Days/Year, 7.1104 × 10¹⁰ kg, 2.5259 × 10⁶ MWh, and 1.6592 × 10¹² INR, respectively. The CO2 emission and the total cost have been reduced by 4.33% and 3.48% lesser than in Case 1. For the 14-year planning span, the minimum cost result is attained by the PSO algorithm. The extension capacity has been deter-mined to be 49 279 MW where biomass, solar, wind, hydro, nuclear, oil, gas, and coal plants contribute 324 MW, 3625 MW, 1750 MW, 125 MW, 5225 MW, 1920 MW, 7560 MW, and 28 750 MW, respectively. Consequently, the accumulative capacity would turn out to be 87 898 MW. Similarly, LOLP, CO2, EENS emission, and total costs are estimated as 0.0943 Days/Year, 6.2059 × 10⁶ MWh, 12.5027 × 10¹⁰ kg, and 3.2654 × 10¹² INR, respectively. The CO2 emission and total cost are minimized by 5.82% and 2.81% compared to Case 1.
Case 3: GEP with recuperation
For the 7-year planning span, the minimum cost result is attained by the DE algorithm. The expansion capacity is anticipated to reach 27 219 MW where biomass, solar, wind, hydro, nuclear, oil, gas, and coal plants contribute 144 MW, 2125 MW, 1000 MW, 65 MW, 3325 MW, 880 MW, 4680 MW, and 15 000 MW, respectively. Hence, the accumulative capacity will become 60 577 MW. Furthermore, the LOLP, EENS, CO2 emission, and total cost are estimated as 0.0357 Days/Year, 1.8601 × 10⁶ MWh, 6.9188 × 10¹⁰ kg, and 1.6030 × 10¹² INR, respectively. The CO2 emission and total cost have been reduced by 6.9% and 6.75% than Case 1. For the 14-year planning span, the minimum cost result is attained by the HSHPSO algorithm. The extension capacity is estimated as 61 882 MW where biomass, solar, wind, hydro, nuclear, oil, gas, and coal plants contribute 432 MW, 432 MW, 4875 MW, 1750 MW, 120 MW, 7125 MW, 2160 MW, 7920 MW, and 37 500 MW, respectively. Consequently, the accu-mulative capacity would turn out to be 95 240 MW. Moreover, the EENS, LOLP, CO2 emission, and total cost are evaluated as 0.9504 × 10⁶ MWh, 0.1010 Days/Year, 12.2049 × 10¹⁰ kg, and 3.2057 × 10¹² INR, respectively. The CO2 emission and total cost are reduced by 7.75% and 4.51% less than in Case 1.
Case 4: GEP with recuperation and retirement
For the 7-year planning span, the minimum cost result is attained by the HSHPSO algorithm. The extension capacity has been evaluated as 30 120 MW where biomass, solar, wind, hydro, nuclear, oil, gas, and coal plants contribute 180 MW, 2250 MW, 875 MW, 70 MW, 3325 MW, 880 MW, 5040 MW, and 17 500 MW, respectively. Consequently, the accumulative capacity will become 63 478 MW. Furthermore, the EENS, LOLP, CO2 emission, and overall cost are estimated as 3.4860 × 10⁶ MWh, 0.0208 Days/Year, 6.6918 × 10¹⁰ kg, and 1.5841 × 10¹² INR, respectively. The CO2 emission and total cost have been reduced by 11.07% and 8.52% compared to Case 1. For the 14-year planning span, the minimum cost result is reached by the HSHPSO algorithm. The additional capacity is estimated as 53 293 MW where biomass, solar, wind, hydro, nuclear, oil, gas, and coal plants contribute 288 MW, 3625 MW, 2250 MW, 125 MW, 7125 MW, 2320 MW, 7560 MW, and 30 000 MW, respectively. Hence, the accumulative capacity would turn out to be 86 651 MW. Likewise, the EENS, LOLP, CO2 discharge and total cost are estimated as 1.2248 × 10⁶ MWh, 0.2610 Days/Year, 12.0846 × 10¹⁰ kg, and 3.1567 × 10¹² INR, respectively. The CO2 emission and total cost have been reduced by 9.48% and 6.35% compared to Case 1. Fig. 2 and Fig. 3 show the Case 4 comparison of analysis for 7 years and 14 years of CO2 emission and EENS, respectively. The results of GEP considering recuperation and retirement using the HSHPSO algorithm are listed in Table 1.


Fig. 4 illuminates the convergence features of PSO, DE, and HSHPSO methods for the results of Case 4 of the 14-years planning horizon. The proposed HSHPSO algorithm is used to solve the GEP problem in this research. The final results are rarely the same, however, as shown in Fig. 4, the convergence speed of the HSHPSO is faster than that of the PSO and DE. From the obtained results, it has been identified that HSHPSO offers most of the optimal results with reduced cost, reduced CO2 emission, and enhanced reliability. The optimal result of 3.1567 × 10¹² INR has been converged at 95th iterations by the HSHPSO algorithm. Moreover, the running time is also minimal in HSHPSO compared to PSO, DE, and dynamic programming (DP), which is shown in Fig. 5.

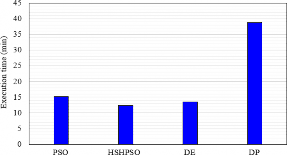
DP converts a multifaceted problem into an order of easier problems; its vital feature is the multistage behaviour of the optimization process. But DP struggles a lot to get the finest solutions while the problem turns out to be multifaceted and for an extended planning span. The mean running time in DP is also high for solving a complex problem. The performance indices of PSO, HSHPSO, and DE for solving Case 4 of the 14-year planning horizon are provided in Table 2. The standard deviation (SD), variance, mean, worst, and best [44] values are calculated. The steadiness of the proposed HSHPSO algorithm has been validated from these parameters. HSHPSO outperformed other variants. The SD and variance have been calculated as 0.000292 and 0.00855. Results of GEP considering recuperation and retirement using HSHPSO are shown in Table 1. Evalua-tion of performance indices for Case 4 of the 14-year planning horizon is shown in Table 2. A comparison between real-time and estimated expansion capacities for 2023 is shown in Table 3.The results have been compared with the actual expansion data provided by Central Electricity Authority (CEA) [37]. This comparison is provided in Table 3. It validates the results and increases the robustness of the proposed expansion plan.
Table 1.
Results of GEP considering recuperation and retirement using HSHPSO.
Statistic |
PSO |
HSHPSO |
DE |
DP |
Mean execution time |
15.27 min |
12.34 min |
13.44 min |
38.87 min |
Best |
3.2279 × 10¹² INR |
3.1567 × 10¹² INR |
3.2408 × 10¹² INR |
3.4082 × 10¹² INR |
Worst |
3.2682 × 10¹² INR |
3.1738 × 10¹² INR |
3.2786 × 10¹² INR |
– |
Mean |
3.2436 × 10¹² INR |
3.1652 × 10¹² INR |
3.25912 × 10¹² INR |
– |
Variance |
0.001624 |
0.000292 |
0.001429 |
– |
SD |
0.02015 |
0.00855 |
0.0189 |
– |
Table 2.
Evaluation of performance indices for Case 4 of the 14-year planning horizon.
Planning Span |
Year |
Categories of plant |
Expansion capacity (MW) |
Overall capacity (MW) |
LOLP (Days/ Year) |
EENS × 106 (MWh) |
Discharged CO2 × 1010 (kg) |
Total cost × 1012 INR |
|||||||
Coal |
Gas |
Oil |
Nuclear |
Hydro |
Wind |
Solar |
Biogas |
||||||||
7 years |
2021 |
1250 |
720 |
240 |
475 |
5 |
0 |
500 |
36 |
3226 |
36584 |
0.0208 |
3.4860 |
6.6918 |
1.5841 |
2022 |
3750 |
1080 |
160 |
0 |
10 |
250 |
250 |
0 |
5500 |
42084 |
|||||
2023 |
0 |
720 |
80 |
475 |
15 |
125 |
0 |
36 |
1451 |
43535 |
|||||
2024 |
2500 |
0 |
80 |
950 |
0 |
250 |
375 |
36 |
4191 |
47726 |
|||||
2025 |
5000 |
720 |
80 |
0 |
10 |
0 |
250 |
36 |
6096 |
53822 |
|||||
2026 |
2500 |
1080 |
0 |
475 |
20 |
125 |
500 |
0 |
4700 |
58522 |
|||||
2027 |
2500 |
720 |
240 |
950 |
10 |
125 |
375 |
36 |
4956 |
63478 |
|||||
14 years |
2021 |
2500 |
0 |
240 |
950 |
15 |
250 |
250 |
0 |
4205 |
37563 |
0.2610 |
1.2248 |
12.0846 |
3.1567 |
2022 |
1250 |
1080 |
160 |
950 |
10 |
250 |
0 |
36 |
3736 |
41299 |
|||||
2023 |
0 |
720 |
80 |
950 |
5 |
125 |
500 |
36 |
2416 |
43715 |
|||||
2024 |
3750 |
720 |
0 |
0 |
20 |
250 |
375 |
0 |
5115 |
48830 |
|||||
2025 |
2500 |
360 |
80 |
475 |
15 |
125 |
0 |
36 |
3591 |
52421 |
|||||
2026 |
5000 |
0 |
320 |
950 |
10 |
250 |
250 |
0 |
6780 |
59201 |
|||||
2027 |
0 |
720 |
240 |
475 |
5 |
0 |
375 |
36 |
1851 |
61052 |
|||||
2028 |
2500 |
720 |
160 |
475 |
0 |
125 |
500 |
0 |
4480 |
65532 |
|||||
2029 |
3750 |
1080 |
160 |
0 |
5 |
250 |
0 |
36 |
5281 |
70813 |
|||||
2030 |
0 |
720 |
320 |
475 |
10 |
0 |
250 |
36 |
1811 |
72624 |
|||||
2031 |
1250 |
0 |
240 |
0 |
10 |
250 |
375 |
0 |
2125 |
74749 |
|||||
2032 |
1250 |
0 |
160 |
475 |
5 |
250 |
0 |
36 |
2176 |
76925 |
|||||
2033 |
2500 |
720 |
80 |
950 |
0 |
0 |
250 |
36 |
4536 |
81461 |
|||||
2034 |
3750 |
720 |
80 |
0 |
15 |
125 |
500 |
0 |
5190 |
86651 |
|||||
Table 3.
Comparison between real‐time and estimated expansion capacities for 2023.
Case |
Coal |
Gas |
Oil |
Nuclear |
Hydro |
Wind |
Solar |
Biogas |
Total |
Actual by CEA |
14 679 |
1027 |
211 |
1448 |
2178 |
8739 |
6539 |
165 |
34 986 |
Proposed |
13 273 |
1747 |
291 |
2398 |
2183 |
8361 |
7095 |
426 |
43 715 |
Highlights of the outcomes
In this study, four various Cases are deliberated to demonstrate the effectiveness of the projected technique on the GEP model. The recuperation concept has been carried out on aging power plants to extend their lifetime and increase performance. Comparative studies have been performed to compare the total cost, amount of CO2 emis-sion, and reliability indices among four Cases. The results indicate that Case 4 (consideration of both recuperation and retirement) offers the best plan with the least cost and minimum CO2 emission. The consideration of recupera-tion has increased the efficiency, availability, and reliability of the system. Moreover, the recuperation has reduced the operation and maintenance costs. The results obtained in Case 4 strongly support the objectives of this study. Most importantly, the estimated overall cost for power generation ranges below the cost sanctioned by the government of Tamil Nadu during the budget [33]. Similarly, the CO2 emission is considerably reduced. At the United Nations Climate Change Conference, India decided to reduce annual average GHG emissions by 2% [45]. The results of the proposed study support the aforesaid agreement.
Conclusions
This paper presents the recuperation and retirement for older plants to solve the GEP problem. According to the Tamil Nadu power system 7-year and 14-year planning perspectives, a variety of goals were achieved such as maximization of reliability, reduction of CO2 emissions, and minimization of cost. To solve this issue, the HSHPSO algorithm is proposed. To prove the effectiveness of the proposed method, it is compared with the existing PSO and DE approaches with four different Cases. According to the results, Case 4 (taking into account both recovery and retirement) provides the most cost-effective plan with low CO2 emissions. The system has become more efficient, reliable, and available by considering recuperation. Moreover, the recuperation has reduced the operation and maintenance costs. It has been identified that the HSHPSO algorithm outperformed other algorithms. In comparison with the GEP with no recuperation or retirement, the total cost and CO2 emissions of the GEP have been reduced by 11.07% and 9.48%, respectively.
Authors’ statement
Research concept and design, A.K.A.; collection and/or assembly of data, S.S.; data analysis and interpre-tation, R.A.; writing the article, A.K.A.; critical revision of the article, B.A.; final approval of article, A.K.A., S.S., R.A., and B.A.
Acknowledgements
The authors would like to express their heartfelt gratitude to the supervisor for his guidance and unwaver-ing support during this research.
References
-
Kerzner, H. Project Management: A Systems Approach to Planning, Scheduling, and Controlling. 12th Edition. (Wiley, 2019).
-
Kaldellis, J., Vlachou, D. S. & Korbakis, G. Techno-economic evaluation of small hydro power plants in Greece: a complete sensitivity analysis. Energy Policy 33, 1969–1985 (2005). https://doi.org/10.1016/j.enpol.2004.03.018
-
IEEE Guide for the Rehabilitation of Hydroelectric Power Plants. in IEEE Std 1147-2005) (Revision of IEEE Std 1147-1991) 1–63 (IEEE, 2006). https://doi.org/10.1109/ieeestd.2006.99379
-
Kannan, S., Slochanal, S. M. R. & Padhy, N. P. Application and comparison of metaheuristic techniques to generation expansion planning problem. IEEE Trans. Power Syst. 20, 466–475 (2005). https://doi.org/10.1109/tpwrs.2004.840451
-
Bhuvanesh, A., Christa, S. T. J., Kannan, S., Pandiyan, M. K. & Gangatharan, K. Application of optimization algorithms to generation expansion planning problem. J. Intell. Fuzzy Syst. 35, 1387–1398 (2018). https://doi.org/10.3233/jifs-169681
-
Sanz-Bermejo, J., Gallardo-Natividad, V., Gonzalez-Aguilar, J. & Romero, M. Comparative system performance analysis of direct steam generation central receiver solar thermal power plants in megawatt range. J. Sol. Energy Eng. 136, 010908-1 (2014). https://doi.org/10.1115/1.4026279
-
Lu, J., Li, G., Cheng, C. & Yu, H. Risk analysis method of cascade plants operation in medium term based on multi-scale market and settlement rules. IEEE Access 8, 90730–90740 (2020). https://doi.org/10.1109/access.2020.2994093
-
Ding, H., Hu, Z. & Song, Y. Stochastic optimization of the daily operation of wind farm and pumped-hydro-storage plant. Renew. Energy 48, 571–578 (2012).https://doi.org/10.1016/j.renene.2012.06.008
-
Weisser, D. & Garcia, R. S. Instantaneous wind energy penetration in isolated electricity grids: concepts and review. Renew. Energy 30, 1299–1308 (2005).https://doi.org/10.1016/j.renene.2004.10.002
-
Kannan, S., Slochanal, S. M. R., Subbaraj, P. & Padhy, N. P. Application of particle swarm optimization technique and its variants to generation expansion planning problem. Electr. Power Syst. Res. 70, 203–210 (2004).https://doi.org/10.1016/j.epsr.2003.12.009
-
Neshat, N. & Amin-Naseri, M. R. Cleaner power generation through market-driven generation expansion planning: an agent- based hybrid framework of game theory and Particle Swarm Optimization. J. Clean. Prod. 105, 206–217 (2015). https://.doi.org/10.1016/j.jclepro.2014.10.083
-
Moghddas-Tafreshi, S. M., Shayanfar, H. A., Saliminia Lahiji, A., Rabiee, A. & Aghaei, J. Generation expansion planning in Pool market: A hybrid modified game theory and particle swarm optimization. Energy Convers. Manag. 52, 1512–1519 (2011). https://doi.org/10.1016/j.enconman.2010.10.019
-
Jin, Y.-X., Cheng, H.-Z., Yan, J.-y. & Zhang, L. New discrete method for particle swarm optimization and its application in transmission network expansion planning. Electr. Power Syst. Res. 77, 227–233 (2007). https://doi.org/10.1016/j.epsr.2006.02.016
-
Abdmouleh, Z., Gastli, A., Ben-Brahim, L., Haouari, M. & Al- Emadi, N. A. Review of optimization techniques applied for the integration of distributed generation from renewable energy sources. Renew. Energy 113, 266–280 (2017). https://doi.org/10.1016/j.renene.2017.05.087
-
Yousefpour, K., Molla, S. J. H. & Hosseini, S. A dynamic approach for distribution system planning using Particle Swarm Optimization. Int. J. Control Sci. Eng. 5, 10–17 (2015). http://article.sapub.org/10.5923.j.control.20150501.02.html
-
Lee, K. Y. & Park, J. Application of Particle Swarm Optimization to Economic Dispatch Problem: Advantages and Disadvantages. in 2006 IEEE Power Systems Conference and Exposition 188–192 (IEEE, 2006).https://doi.org/10.1109/psce.2006.296295
-
Wong, L. Y., Rahim, S. R. A., Sulaiman, M. H. & Aliman, O. Distributed Generation Installation Using Particle Swarm Optimization. in 2010 4th International Power Engineering and Optimization Conference (PEOCO) 159–163 (IEEE, 2010). https://doi.org/10.1109/peoco.2010.5559168
-
Bhuvanesh, A. et al. Application of differential evolution algorithm and its variants for solving energy storage technologies integrated generation expansion planning. Iran. J. Sci. Technol. Trans. Electr. Eng. 43, 883–896 (2019). https://doi.org/10.1007/s40998-019-00190-x
-
Bhuvanesh, A., Jaya Christa, S. T., Kannan, S. & Karuppasamy Pandiyan, M. Aiming towards pollution free future by high penetration of renewable energy sources in electricity generation expansion planning. Futures 104, 25–36 (2018). https://doi.org/10.1016/j.futures.2018.07.002
-
Rajesh, K., Kannan, S. & Thangaraj, C. Least cost generation expansion planning with wind power plant incorporating emission using Differential Evolution algorithm. Int. J. Electr. Power Energy Syst. 80, 275–286 (2016).https://doi.org/10.1016/j.ijepes.2016.01.047
-
Franco, A. & Salza, P. Perspectives for the long-term penetration of new renewables in complex energy systems: the Italian Case. Environ. Dev. Sustain. 13, 309–330 (2011). https://doi.org/10.1007/s10668-010-9263-7
-
Praso, N. & Dzindo, M. Rehabilitation and conversion of coal- based power plants to cogeneration plants for increased efficiency. Cogener. Distrib. Gener. J. 20, 48–69 (2005). https://doi.org/10.1080/15453660509509063
-
Ardizzon, G., Cavazzini, G. & Pavesi G. A new generation of small hydro and pumped-hydro power plants: Advances and future challenges. Renew. Sustain. Energy Rev. 31, 746–761 (2014). https://doi.org/10.1016/j.rser.2013.12.043
-
Adhau, S. P., Moharil, R. M. & Adhau, P. G. Mini-hydro power generation on existing irrigation projects: Case study of Indian sites. Renew. Sustain. Energy Rev. 16, 4785–4795 (2012). https://doi.org/10.1016/j.rser.2012.03.066
-
Hernandez, T. & Diaz, E. Risk Analysis in the Rehabilitation of Hydro Unit at the Guri Plant. in 2006 IEEE/PES Transmission and Distribution Conference and Exposition 1–5 (IEEE, 2006). https://doi.org/10.1109/tdcla.2006.311483
-
Fette, M., Weber, C., Peter, A. & Wehrli, B. Hydropower production and river rehabilitation: A case study on an alpine river. Environ. Model. Assess. 12, 257–267 (2007). https://doi.org/10.1007/s10666-006-9061-7
-
Karunanithi, K., Ramesh, S., Raja, S. P. & Rowlo, P. K. Genera- tion expansion planning considering environmental impact and sustainable development for an Indian state using the LEAP platform. Util. Policy 86, 101702 (2024). https://doi.org/10.1016/j.jup.2023.101702
-
Choubineh, K., Yousefi, H. & Moeini-Aghtaie, M. Developing a new flexibility-oriented model for generation expansion planning studies of renewable-based energy systems. Energy Rep. 11, 706– 719 (2024). https://doi.org/10.1016/j.egyr.2023.12.019
-
da Luz, T. An adaptive peak load day for bidirectional soft-linking approach in generation expansion planning considering short-term problem. Int. J. Electr. Power Energy Syst. 157, 109818 (2024). https//doi.org/10.1016/j.ijepes.2024.109818
-
Tawney, R. K., Bonner, J. A. & Elgawhary, A. M. Economic and Performance Evaluation of Combined Cycle Repowering Options. in ASME Turbo Expo: Power for Land, Sea, and Air 457–464 (ASME, 2002). https://doi.org/10.1115/gt2002-30565
-
Andreini, A. & Facchini, B. Gas Turbines Design and Off-Design Performance Analysis with Emissions Evaluation. in ASME Turbo Expo: Power for Land, Sea, and Air 271–281 (ASME, 2002). https://doi.org/10.1115/gt2002-30258
-
Pandzic, H., Conejo, A., Kuzle, I. & Caro, E. Yearly maintenance scheduling of transmission lines within a market environment. IEEE Transactions on Power Systems 27, 407–415 (2012). https://doi.org/10.1109/tpwrs.2011.2159743
-
Karunanithi, K., Kannan, S. & Thangaraj, C. Generation expansion planning for Tamil Nadu: a case study. Int. Trans. Electr. Energy Syst. 25, 1771–1787 (2015). https://doi.org/10.1002/etep.1929
-
U.S. Energy information Administration. Capital Cost and Performance Characteristics for Utility-Scale Electric Power Generating Technologies (2024). https://www.eia.gov/analysis/studies/powerplants/capitalcost/
-
National Renewable Energy Laboratory. 2018 Annual Technology Baseline ATB Cost and Performance Data for Electricity Generation Technologies – Interim Data without Geothermal Updates. USA (2018). https://data.nrel.gov/submissions/89
-
Government of Tamil Nadu. The Vision Tamil Nadu 2023. Strategic Plan for Infrastructure Development in Tamil Nadu (2014). https://agritech.tnau.ac.in/pdf/2012/TN%20VISION%202023_Volume%20II.pdf
-
Government of India. Ministry of Power. Central Electricity Authority. All India Installed Capacity (in MW) of Power Stations. New Delhi, India (2021).https://cea.nic.in/installed-capacity-report/?lang=en
-
Bhuvanesh, A., Jaya Christa, S. T., Kannan, S. & Karuppasamy Pandiyan, M. Multistage multiobjective electricity generation expansion planning for Tamil Nadu considering least cost and minimal GHG emission. Int. Trans. Electr. Energy Syst. 29, e2708 (2019). https://doi.org/10.1002/etep.2708
-
Dhiman, G. & Kumar, V. Multi-objective spotted hyena optimizer: a multi-objective optimization algorithm for engineering problems. Knowl.-Based Syst. 150, 75–197 (2018).
-
Yıldız, B. S. The spotted hyena optimization algorithm for weight- reduction of automobile brake components. Mater. Test. 62, 383– 388 (2020). https://doi.org/10.3139/120.111495
-
Das, S. R., Sahoo, A. K., Dhiman, G., Singh, K. K. & Singh, A. Photo voltaic integrated multilevel inverter-based hybrid filter using spotted hyena optimizer. Comput. Electr. Eng. 96, 107510 (2021). https://doi.org/10.1016/j.compeleceng.2021.107510
-
Li, X. & Yao, X. Cooperatively coevolving particle swarms for large scale optimization. IEEE Trans. Evol. Comput. 16, 210–224 (2012).https://doi.org/10.1109/tevc.2011.2112662
-
Zhou, J., Fang, W., Wu, X., Sun, J. & Cheng, S. An Opposition- Based Learning Competitive Particle Swarm Optimizer. in 2016 IEEE Congress on Evolutionary Computation (CEC) 515–521 (IEEE, 2016). https://doi.org/10.1109/cec.2016.7743837
-
Deb, K., Mohan, M. & Mishra, B. A Fast Multi-Objective Evolutionary Algorithm for Finding Well-Spread Pareto-Optimal Solutions. KanGAL report no. 2003002 (2003). https://www.egr.msu.edu/~kdeb/papers/k2003002.pdf
-
Ministry of Science and Technology. India Is Committed To Achieve The Net Zero Emissions Target By 2070 (2023). https://pib.gov.in/PressReleaseIframePage.aspx?PRID=1961797